Élections législatives de 1988 dans le Rhône
Les élections législatives françaises de 1988 se déroulent les et . Dans le département du Rhône, quatorze députés sont à élire dans le cadre de quatorze circonscriptions.
| ||||||||||||||
| Élections législatives de 1988 dans le Rhône | ||||||||||||||
| 14 sièges de députés à l'Assemblée nationale | ||||||||||||||
|---|---|---|---|---|---|---|---|---|---|---|---|---|---|---|
| et | ||||||||||||||
| Corps électoral et résultats | ||||||||||||||
| Inscrits au 1er tour | 881 956 | |||||||||||||
| Votants au 1er tour | 543 820 | |||||||||||||
| 61,66 % | ||||||||||||||
| Votes exprimés au 1er tour | 536 372 | |||||||||||||
| Inscrits au 2d tour | 612 292 | |||||||||||||
| Votants au 2d tour | 384 896 | |||||||||||||
| 62,86 % | ||||||||||||||
| Votes exprimés au 2d tour | 371 622 | |||||||||||||
| Union du Rassemblement et du Centre | ||||||||||||||
| Voix au 1er tour | 232 724 | |||||||||||||
| 43,39 % | ||||||||||||||
| Voix au 2e tour | 180 034 | |||||||||||||
| 48,45 % | ||||||||||||||
| Députés élus | 9 | |||||||||||||
| La France Unie | ||||||||||||||
| Voix au 1er tour | 179 790 | |||||||||||||
| 33,52 % | ||||||||||||||
| Voix au 2e tour | 184 664 | |||||||||||||
| 49,69 % | ||||||||||||||
| Députés élus | 5 | |||||||||||||
| Front national | ||||||||||||||
| Voix au 1er tour | 74 101 | |||||||||||||
| 13,82 % | ||||||||||||||
| Voix au 2e tour | 6 924 | |||||||||||||
| 1,86 % | ||||||||||||||
| Députés élus | 0 | |||||||||||||
| Parti communiste français | ||||||||||||||
| Voix au 1er tour | 47 553 | |||||||||||||
| 8,87 % | ||||||||||||||
| Députés élus | 0 | |||||||||||||
| Députés élus par circonscription | ||||||||||||||
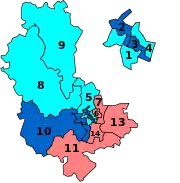
| ||||||||||||||
Élus
| Circonscription | Député sortant | Parti | Député élu ou réélu | Parti | ||
|---|---|---|---|---|---|---|
| 1e | Scrutin proportionnel | Bernadette Isaac-Sibille | UDF (CDS) | |||
| 2e | Michel Noir | RPR | ||||
| 3e | Jean-Michel Dubernard | RPR | ||||
| 4e | Raymond Barre | app. UDF | ||||
| 5e | Jean Rigaud | UDF (AD) | ||||
| 6e | Charles Hernu | PS | ||||
| 7e | Jean-Jack Queyranne | PS | ||||
| 8e | Alain Mayoud | UDF (PR) | ||||
| 9e | Francisque Perrut | UDF (PR) | ||||
| 10e | Jean Besson | RPR | ||||
| 11e | Gabriel Montcharmont | PS | ||||
| 12e | Michel Terrot | RPR | ||||
| 13e | Jean Poperen | PS | ||||
| 14e | Marie-Josèphe Sublet | PS | ||||
Positionnement des partis
L'UDF et le RPR se présentent unis sous l'étiquette « Union du Rassemblement et du Centre » tandis que les candidats du Parti socialiste se rangent sous la bannière de la « Majorité présidentielle pour la France unie », slogan de la campagne présidentielle de François Mitterrand.
Résultats
Résultats à l'échelle du département
| Parti | Premier tour | Second tour | Sièges | |||
|---|---|---|---|---|---|---|
| Voix | % | Voix | % | |||
| Union pour la démocratie française | 129 618 | 24,17 | 75 469 | 20,31 | 5 | |
| Rassemblement pour la République | 97 596 | 18,20 | 104 565 | 28,14 | 4 | |
| Divers droite | 5 510 | 1,03 | Retrait | 0 | ||
| Union du Rassemblement et du centre | 232 724 | 43,39 | 180 034 | 48,45 | 9 | |
| Parti socialiste | 178 521 | 33,28 | 184 664 | 49,69 | 5 | |
| Divers gauche (Maj. prés.) | 1 269 | 0,24 | 0 | |||
| La France unie | 179 790 | 33,52 | 184 664 | 49,69 | 5 | |
| Front national | 74 101 | 13,82 | 6 924 | 1,86 | 0 | |
| Parti communiste français | 47 553 | 8,87 | Retrait | 0 | ||
| Les Verts | 2 040 | 0,38 | 0 | |||
| Parti ouvrier européen | 164 | 0,03 | 0 | |||
| Inscrits | 881 956 | 100,00 | 612 292 | 100,00 | 14 | |
| Abstentions | 338 136 | 38,34 | 227 396 | 37,14 | ||
| Votants | 543 820 | 61,66 | 384 896 | 62,86 | ||
| Blancs et nuls | 7 448 | 1,37 | 13 274 | 3,45 | ||
| Exprimés | 536 372 | 98,63 | 371 622 | 96,55 | ||
Première circonscription
| Candidat | Parti | Premier tour | Second tour | ||||
|---|---|---|---|---|---|---|---|
| Voix | % | Voix | % | ||||
| Bernadette Isaac-Sibille sortante réélue | UDF (CDS) | 12 447 | 38,73 | 17 446 | 51,44 | ||
| Gérard Collomb sortant | PS | 12 042 | 37,46 | 16 469 | 48,56 | ||
| Joseph Ledant | FN | 4 182 | 13,01 | ||||
| Guy Front | PCF | 2 202 | 6,85 | ||||
| Émile Vasquez | Divers gauche (Maj. prés.) | 1 269 | 3,95 | ||||
| Inscrits | 54 008 | 100,00 | 54 008 | 100,00 | |||
| Abstentions | 21 474 | 39,76 | 19 167 | 35,49 | |||
| Votants | 32 534 | 60,24 | 34 841 | 64,51 | |||
| Blancs et nuls | 392 | 1,2 | 926 | 2,66 | |||
| Exprimés | 32 142 | 98,8 | 33 915 | 97,34 | |||
Deuxième circonscription
| Candidat | Parti | Premier tour | Second tour | ||||
|---|---|---|---|---|---|---|---|
| Voix | % | Voix | % | ||||
| Michel Noir sortant réélu | RPR | 18 877 | 47,83 | 23 494 | 58,82 | ||
| Pierre Laréal | PS | 12 231 | 30,99 | 16 448 | 41,18 | ||
| Bruno d'Épenoux | FN | 5 390 | 13,66 | ||||
| Yves Fournel | PCF | 2 112 | 5,35 | ||||
| Jacques Printemps | Les Verts | 860 | 2,18 | ||||
| Inscrits | 65 710 | 100,00 | 65 710 | 100,00 | |||
| Abstentions | 25 825 | 39,3 | 24 588 | 37,42 | |||
| Votants | 39 885 | 60,7 | 41 122 | 62,58 | |||
| Blancs et nuls | 415 | 1,04 | 1 180 | 2,87 | |||
| Exprimés | 39 470 | 98,96 | 39 942 | 97,13 | |||
Troisième circonscription
| Candidat | Parti | Premier tour | Second tour | ||||
|---|---|---|---|---|---|---|---|
| Voix | % | Voix | % | ||||
| Jean-Michel Dubernard sortant réélu | RPR | 15 425 | 44,98 | 20 426 | 58,15 | ||
| Jean-Pierre Flaconnèche | PS | 10 794 | 31,47 | 14 700 | 41,85 | ||
| Maurice Depierre | FN | 5 143 | 15 | ||||
| René Chevailler | PCF | 2 932 | 8,55 | ||||
| Inscrits | 58 091 | 100,00 | 58 091 | 100,00 | |||
| Abstentions | 23 368 | 40,23 | 22 270 | 38,34 | |||
| Votants | 34 723 | 59,77 | 35 821 | 61,66 | |||
| Blancs et nuls | 429 | 1,24 | 695 | 1,94 | |||
| Exprimés | 34 294 | 98,76 | 35 126 | 98,06 | |||
Quatrième circonscription
| Candidat | Parti | Premier tour | |||||
|---|---|---|---|---|---|---|---|
| Voix | % | ||||||
| Raymond Barre sortant réélu | app. UDF | 21 152 | 55,78 | ||||
| Martine Roure | PS | 9 518 | 25,1 | ||||
| Jacqueline Barral | FN | 5 193 | 13,69 | ||||
| Georges Mazard | PCF | 1 895 | 5 | ||||
| Ruth Pierre | POE | 164 | 0,43 | ||||
| Inscrits | 62 305 | 100,00 | |||||
| Abstentions | 23 929 | 38,41 | |||||
| Votants | 38 376 | 61,59 | |||||
| Blancs et nuls | 454 | 1,18 | |||||
| Exprimés | 37 922 | 98,82 | |||||
Cinquième circonscription (Neuville-sur-Saône)
| Candidat | Parti | Premier tour | |||||
|---|---|---|---|---|---|---|---|
| Voix | % | ||||||
| Jean Rigaud sortant réélu | UDF (AD) | 24 501 | 51,78 | ||||
| Jean Machurat | PS | 14 880 | 31,45 | ||||
| Jean-Paul Henry | FN | 5 892 | 12,45 | ||||
| Gérard Crouzet | PCF | 2 041 | 4,31 | ||||
| Inscrits | 73 581 | 100,00 | |||||
| Abstentions | 25 717 | 34,95 | |||||
| Votants | 47 864 | 65,05 | |||||
| Blancs et nuls | 550 | 1,15 | |||||
| Exprimés | 47 314 | 98,85 | |||||
Sixième circonscription (Villeurbanne)
| Candidat | Parti | Premier tour | Second tour | ||||
|---|---|---|---|---|---|---|---|
| Voix | % | Voix | % | ||||
| Charles Hernu sortant réélu | PS | 17 523 | 46,61 | 22 409 | 57,52 | ||
| René Basse | RPR | 10 374 | 27,59 | 16 549 | 42,48 | ||
| Pierre Vial | FN | 6 261 | 16,65 | ||||
| Pierre Grannec | PCF | 3 436 | 9,14 | ||||
| Inscrits | 62 883 | 100,00 | 62 583 | 100,00 | |||
| Abstentions | 24 568 | 39,07 | 22 592 | 36,1 | |||
| Votants | 38 315 | 60,93 | 39 991 | 63,9 | |||
| Blancs et nuls | 721 | 1,88 | 1 033 | 2,58 | |||
| Exprimés | 37 594 | 98,12 | 38 958 | 97,42 | |||
Septième circonscription (Vaulx-en-Velin)
| Candidat | Parti | Premier tour | Second tour | ||||
|---|---|---|---|---|---|---|---|
| Voix | % | Voix | % | ||||
| Jean-Jack Queyranne sortant réélu | PS | 10 975 | 32,89 | 18 525 | 53,23 | ||
| Marcel André | UDF (AD) | 9 695 | 29,06 | 16 279 | 46,77 | ||
| Denis de Bouteiller | FN | 6 268 | 18,79 | ||||
| Maurice Charrier | PCF | 4 570 | 13,7 | ||||
| Jean Brière | Les Verts | 1 180 | 3,54 | ||||
| Laurent Clamaron | Divers droite | 676 | 2,03 | ||||
| Inscrits | 60 909 | 100,00 | 60 910 | 100,00 | |||
| Abstentions | 27 129 | 44,54 | 25 186 | 41,35 | |||
| Votants | 33 780 | 55,46 | 35 724 | 58,65 | |||
| Blancs et nuls | 416 | 1,23 | 920 | 2,58 | |||
| Exprimés | 33 364 | 98,77 | 34 804 | 97,42 | |||
Huitième circonscription (Tarare)
| Candidat | Parti | Premier tour | |||||
|---|---|---|---|---|---|---|---|
| Voix | % | ||||||
| Alain Mayoud sortant réélu | UDF (PR) | 25 044 | 57,09 | ||||
| Christian Gunther | PS | 12 840 | 29,27 | ||||
| Albert Rosset | FN | 3 807 | 8,68 | ||||
| Henri Papot | PCF | 2 173 | 4,95 | ||||
| Inscrits | 66 895 | 100,00 | |||||
| Abstentions | 22 304 | 33,34 | |||||
| Votants | 44 591 | 66,66 | |||||
| Blancs et nuls | 727 | 1,63 | |||||
| Exprimés | 43 864 | 98,37 | |||||
Neuvième circonscription (Villefranche-sur-Saône)
| Candidat | Parti | Premier tour | Second tour | ||||
|---|---|---|---|---|---|---|---|
| Voix | % | Voix | % | ||||
| Francisque Perrut sortant réélu | UDF (PR) | 16 563 | 42,15 | 25 657 | 59,92 | ||
| André Poutissou | PS | 12 632 | 32,15 | 17 162 | 40,08 | ||
| Georges Pham-Dinh | FN | 4 071 | 10,36 | ||||
| Jean-Paul Gasquet | diss. RPR | 4 051 | 10,31 | ||||
| Michel Lebail | PCF | 1 975 | 5,03 | ||||
| Inscrits | 64 746 | 100,00 | 64 741 | 100,00 | |||
| Abstentions | 24 912 | 38,48 | 21 111 | 32,61 | |||
| Votants | 39 834 | 61,52 | 43 630 | 67,39 | |||
| Blancs et nuls | 542 | 1,36 | 811 | 1,86 | |||
| Exprimés | 39 292 | 98,64 | 42 819 | 98,14 | |||
Dixième circonscription (Vaugneray)
| Candidat | Parti | Premier tour | |||||
|---|---|---|---|---|---|---|---|
| Voix | % | ||||||
| Jean Besson sortant réélu | RPR | 23 232 | 56,09 | ||||
| Yvette Perrin-Riss | PS | 11 592 | 27,99 | ||||
| Alain Ruet | FN | 4 601 | 11,11 | ||||
| Henri Malod | PCF | 1 996 | 4,82 | ||||
| Inscrits | 64 149 | 100,00 | |||||
| Abstentions | 22 119 | 34,48 | |||||
| Votants | 42 030 | 65,52 | |||||
| Blancs et nuls | 609 | 1,45 | |||||
| Exprimés | 41 421 | 98,55 | |||||
Onzième circonscription (Givors)
| Candidat | Parti | Premier tour | Second tour | ||||
|---|---|---|---|---|---|---|---|
| Voix | % | Voix | % | ||||
| Gabriel Montcharmont élu | PS | 12 582 | 32,62 | 21 374 | 51,89 | ||
| Jean-Claude Bahu | RPR | 10 921 | 28,32 | 19 819 | 48,11 | ||
| Camille Vallin | PCF | 6 197 | 16,07 | ||||
| Franck Levasseur | FN | 4 861 | 12,6 | ||||
| Alfred Gerin | UDF (CDS) | 4 007 | 10,39 | ||||
| Inscrits | 60 969 | 100,00 | 60 965 | 100,00 | |||
| Abstentions | 21 848 | 35,83 | 18 804 | 30,84 | |||
| Votants | 39 121 | 64,17 | 42 161 | 69,16 | |||
| Blancs et nuls | 553 | 1,41 | 968 | 2,3 | |||
| Exprimés | 38 568 | 98,59 | 41 193 | 97,7 | |||
Douzième circonscription (Oullins)
| Candidat | Parti | Premier tour | Second tour | ||||
|---|---|---|---|---|---|---|---|
| Voix | % | Voix | % | ||||
| Michel Terrot sortant réélu | RPR | 18 767 | 45,46 | 24 277 | 55,14 | ||
| René Lambert | PS | 13 783 | 33,39 | 19 751 | 44,86 | ||
| Jean-Marie Mick | PCF | 4 444 | 10,77 | ||||
| Alain Chevalier | FN | 4 287 | 10,38 | ||||
| Inscrits | 66 154 | 100,00 | 66 152 | 100,00 | |||
| Abstentions | 24 411 | 36,9 | 21 382 | 32,32 | |||
| Votants | 41 743 | 63,1 | 44 770 | 67,68 | |||
| Blancs et nuls | 462 | 1,11 | 742 | 1,66 | |||
| Exprimés | 41 281 | 98,89 | 44 028 | 98,34 | |||
Treizième circonscription (Meyzieu)
| Candidat | Parti | Premier tour | Second tour | ||||
|---|---|---|---|---|---|---|---|
| Voix | % | Voix | % | ||||
| Jean Poperen sortant réélu | PS | 17 586 | 41,33 | 23 758 | 50,90 | ||
| Michel Mauclair | UDF (CDS) | 11 897 | 27,96 | 16 087 | 34,46 | ||
| Bruno Gollnisch sortant | FN | 9 046 | 21,26 | 6 924 | 14,83 | ||
| Françoise Pagano | PCF | 3 543 | 8,33 | ||||
| Yves Guyon | Divers droite | 477 | 1,12 | ||||
| Inscrits | 72 272 | 100,00 | 72 271 | 100,00 | |||
| Abstentions | 29 043 | 40,19 | 24 659 | 34,12 | |||
| Votants | 43 229 | 59,81 | 47 612 | 65,88 | |||
| Blancs et nuls | 680 | 1,57 | 943 | 1,98 | |||
| Exprimés | 42 549 | 98,43 | 46 669 | 98,02 | |||
Quatorzième circonscription (Vénissieux)
| Candidat | Parti | Premier tour | Second tour | ||||
|---|---|---|---|---|---|---|---|
| Voix | % | Voix | % | ||||
| Marie-Josèphe Sublet sortante réélue | PS | 9 543 | 34,96 | 14 068 | 100,00 | ||
| Charles Fiterman sortant | PCF | 8 037 | 29,44 | Retrait | |||
| Maurice Joannon | FN | 5 099 | 18,68 | ||||
| Gabriel Paillasson | UDF (Rad) | 4 312 | 15,80 | ||||
| Alain Martinez | Divers droite | 306 | 1,12 | ||||
| Inscrits | 49 284 | 100,00 | 46 861 | 100,00 | |||
| Abstentions | 21 489 | 43,6 | 27 637 | 58,98 | |||
| Votants | 27 795 | 56,4 | 19 224 | 41,02 | |||
| Blancs et nuls | 498 | 1,79 | 5 156 | 26,82 | |||
| Exprimés | 27 297 | 98,21 | 14 068 | 73,18 | |||
Articles connexes
Notes et références
 Portail de la politique française
  Portail du département du Rhône
  Portail des années 1980
Cet article est issu de Wikipedia. Le texte est sous licence Creative Commons – Attribution – Partage à l’identique. Des conditions supplémentaires peuvent s’appliquer aux fichiers multimédias.